- Cryptogram
- Posts
- Between Highs and Lows: Bitcoin’s Balancing Act
Between Highs and Lows: Bitcoin’s Balancing Act
Reading Bitcoin’s Mid-Cycle Reset
Giottus Team
October 24, 2025

Reading Bitcoin’s Mid-Cycle Reset
24 October 2025
After racing past $126K, Bitcoin seems to have remembered it is not in a marathon. It has been catching its breath near $108K, giving traders just enough suspense to refresh their charts every ten minutes. The usual suspects like tariffs, Fed talk, and overzealous leverage, have kept the market busy second-guessing itself. But underneath the noise, the fundamentals have not flinched. ETF inflows remain steady, long-term holders are unbothered, and history suggests this breather may be a setup, not a stumble. This week, we look at why Bitcoin’s latest pause might be less of a warning sign and more of a warm-up.

Bitcoin briefly touched a fresh all‑time high of $126K on October 7, 2025 before pulling back sharply during the following week. The trigger was not an on‑chain defect but an exogenous shock. From those lows Bitcoin recovered to the $108K area but has since been unable to reclaim the prior top, oscillating in a $105K–$114K range. In this week’s Hot Take, we look at why Bitcoin’s latest pause might be less of a warning sign and more of a warm-up.
Top-3 stories of the week:
1
2
3
The newsletter is put together by Giottus Crypto Platform. You can read all the previous issues of Cryptogram here.
Was this newsletter forwarded to you?
WEEKLY MACROS
Total crypto market cap - $3.72 trillion - UP 3.05%
Bitcoin price - $110,476 - UP 3.56%
The dollar index (DXY) - 99.03 - UP 1%
Bitcoin Dominance - 59.93% - UP 0.4%
Crypto Fear and Greed Index - 30 - Market is in Fearful state
THE HOT TAKE
Inside Bitcoin’s Mid-Cycle Cleansing Phase
Despite that turbulence, the underlying trend remains constructive. On‑chain data show spot demand from ETFs and long‑term holders remains positive, while perpetuals funding rates and open interest have reset lower after October’s washout. The next key support lies near the 50‑week simple moving average (SMA) around $102.5K–$101.7K. A retest of this zone would mainly “flush” remaining leverage rather than break the cycle.
This week, we unpack why that final flush is plausible, why the price is consolidating despite strong spot inflows, and how to distinguish genuine breakouts from bull/bear traps.
The “Final Flush” Scenario
Leverage Overhang & Market Mechanics:
Bitcoin’s October drop was made worse by traders using too much leverage. Most crypto trading now happens through perpetual futures (“perps”), which make up over 90% of all derivatives activity and allow people to trade with 10X or higher leverage. In early October, open interest in Bitcoin futures hit nearly $80 billion, close to record highs, while funding rates stayed slightly positive. When Trump announced his 100% tariff threat, prices suddenly fell, triggering automatic liquidations worth around $19 billion, dragging Bitcoin down to roughly $104K.
After the crash, the market began to cool off. Open interest dropped by about 30%, and funding rates turned neutral or even negative, meaning traders were less willing to take risky long bets. By 17 October, open interest had fallen to its lowest level of 2025, and total long liquidations (about $350 million) outweighed shorts ($260 million) this week. We believe this reset isn’t over yet as there’s still too much fragility in bullish positions. If Bitcoin dips toward the $106K range again, it could trigger another round of forced selling and push prices briefly into the $104 K–$102K zone (the 50-week moving average) before the next leg up begins.
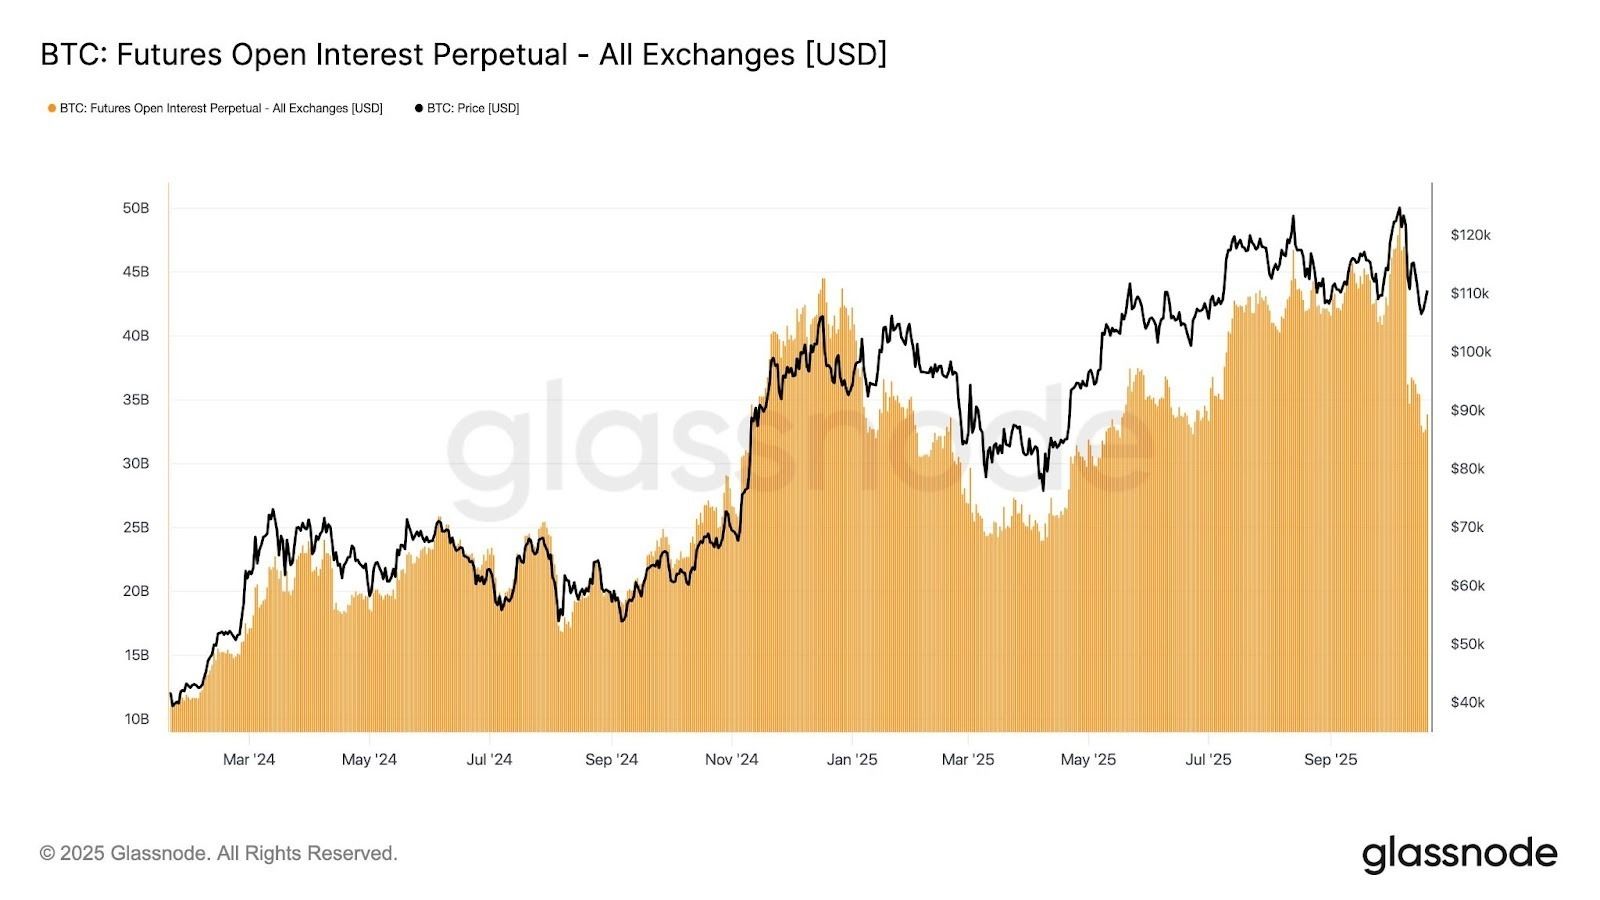
Source: Glassnode on X
Historical Reset Patterns
Bitcoin’s current setup looks a lot like earlier mid-cycle “cleanses” that reset leverage before the next leg higher. After reaching a local top in early October, we’ve seen stretched positioning unwind, much like past pullbacks that briefly tested key support before continuing the uptrend. In April 2025, Bitcoin fell to about $74K (right on the 50-week moving average) before bouncing sharply, and in August 2024, it dropped to $49K at the same level before reversing higher. Sentiment in both cases was grim, yet those lows became launchpads for the next run.
We may be in a similar phase now: an overheated market hitting resistance, followed by a reset that washes out excess leverage. History shows this pattern repeated in 2017 and 2021, when drawdowns of 30–50% cleared speculative froth and funding rates before spot demand took over again. Each time, traders who mistook the correction for a full-blown bear market ended up selling near the bottom, just as momentum was about to return. This cycle’s version of that cleanup may come through a dip to the $105 K–$102K zone, setting the stage for the next sustained move upward.
Technical and Behavioural Confluence Around $104K–$102K
Bitcoin’s chart and trader behaviour both point to one more potential dip before the trend resumes. The 50-week simple moving average (SMA) — often seen as the bull market’s baseline — now sits near $102.3K–$101.7K, a zone that has acted as strong support since mid-2023. Each time price touched it, former resistance turned into support, showing how traders anchor to round levels and long-term averages.
There is also a behavioural layer at play. Many traders still recall this month’s liquidation drop, and are likely to cluster stop-losses and buy orders near $104K, where the last flush occurred. If Bitcoin revisits this area, we could see a familiar pattern: weak longs getting washed out while fresh buyers step in.
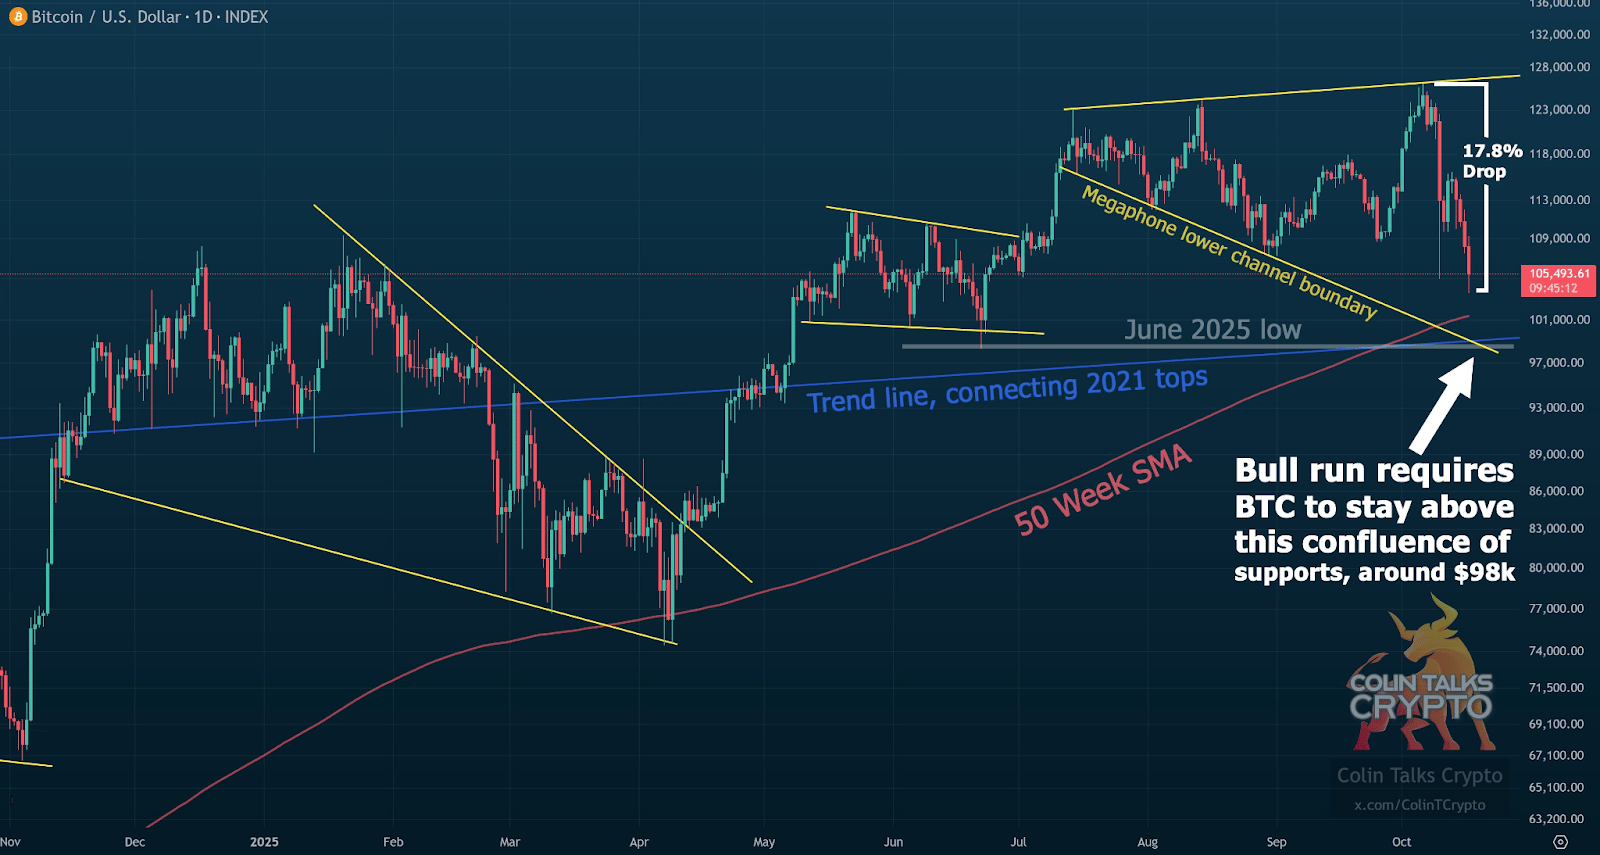
Source: Colin Talks Crypto in X
Why Bitcoin Is Stuck in Neutral:
Spot ETF flows is not the villain
Even though Bitcoin has been volatile through October, real demand is being masked by other forces. Spot buyers, including ETF investors and large holders, after days of outflows did turn positive and continue to accumulate. But this buying pressure isn’t showing up because it’s being absorbed by selling in the derivatives market and broader macro uncertainty. After the tariff scare, traders using leverage rushed to reduce risk, and market makers hedged aggressively in futures, which offset the positive impact of ETF and whale buying.
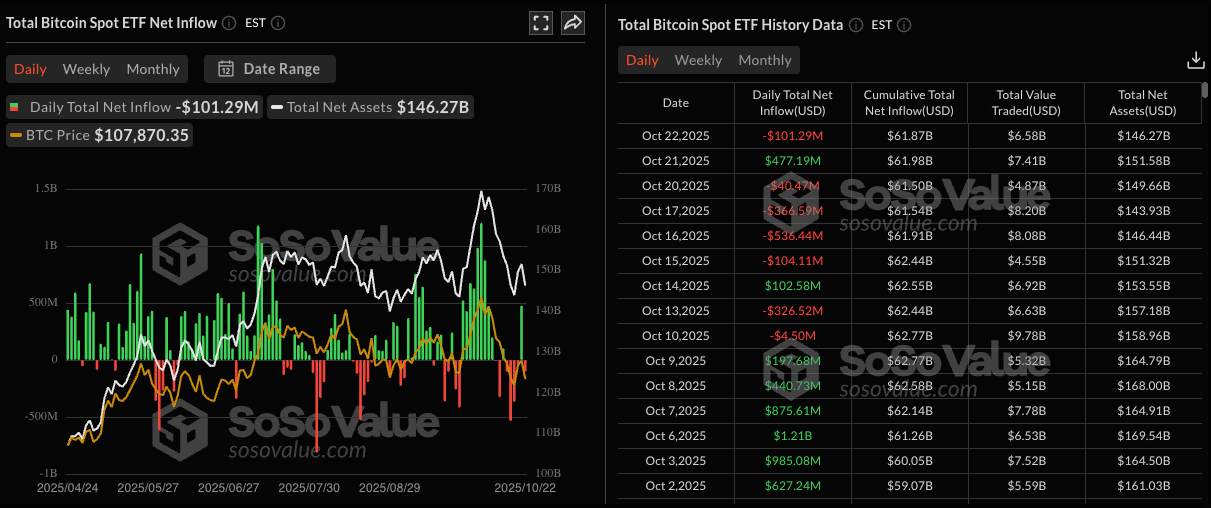
Source: SoSoValue
In simple terms, when spot investors buy Bitcoin, derivatives traders often short it at the same time to stay neutral. So, price doesn’t move much even though money is flowing in. Add to that a cautious global backdrop, where investors are waiting for clearer signals on policy and growth, and you get a market that looks stuck: strong underlying demand, but short-term noise keeping prices in check.
Macro Headwinds Suppressing Risk Appetite
The ongoing U.S.–China tariff tensions have made investors more cautious toward risk assets in general, and crypto still trades as a risk-on asset class. When global equities wobble or trade tensions flare, traders tend to pull back from volatile markets like Bitcoin. At the same time, the Fed’s late-October meeting is adding another layer of hesitation. With key U.S. economic data delayed by the government shutdown, policymakers are effectively “flying blind,” and markets fear a policy misstep even if a modest rate cut happens.
Meanwhile, signals from bonds and currencies show that investors are parking capital rather than chasing returns — the 10-year Treasury yield dropped below 4%, inflation expectations eased, and the U.S. dollar stayed steady, all of which reflect a risk-off tone. In that environment, highly volatile assets such as Bitcoin become an easy source of liquidity for traders trimming exposure. Put simply, even though structural demand for BTC remains strong, the combination of trade tensions, policy uncertainty, and low confidence across markets keep capital on the sidelines. Until those headwinds clear, Bitcoin is likely to stay in a consolidation phase rather than breaking out.
Trap-Proofing in the Chop: A Practical Guide
Look for structure shifts: In a genuine uptrend, you will see higher highs and higher lows with price accepted above the old range. Wait until the market clearly defines its structure before committing.
Wait for candle closes, not wicks: Avoid reacting to the first spike through resistance. A true breakout means a 4-hour or daily close above the level, followed by a clean retest that holds as support. One-off moves on thin volume are textbook bull traps.
Watch funding and open interest (OI): Spikes in OI without matching price progress usually mean leverage is crowding in.
Strongly positive funding → long crowding → bull trap risk.
Strongly negative funding → short crowding → bear trap risk.
The healthiest setups form when OI is moderate and funding is flat; plenty of room to expand.
Use liquidation heatmaps: Tools like CoinGlass show where stop-loss clusters sit. Price often sweeps these areas before reversing. Knowing where the liquidity lies helps you stay patient instead of getting caught in fake breakouts.
Track ETF flow timing: Most U.S. ETF flows settle during evening IST (7:30–10:30 PM). If Bitcoin breaks out alongside new ETF inflows, that’s institutional validation. If it happens on outflow days, stay cautious - it’s often noise.
Stay clear during headline hours: Tariff updates, Fed meetings, and macro data drops create temporary volatility. Wait for markets to digest the news before entering.
Final Takeaway: Controlled Reset, Not Collapse
Bitcoin’s current phase looks less like a top and more like a reset within a larger bull cycle. The leverage-driven flush this month cleared excess risk but did not break structural demand as ETFs, long-term holders, and whales continue to buy dips. Historically, every cycle has featured a similar cleansing move near the 50-week moving average, resetting funding rates and sentiment before the uptrend resumes.
Short-term, the market is caught between strong spot inflows and macro headwinds — tariffs, US Fed uncertainty, and low liquidity — creating the illusion of stagnation. In reality, this is the build-up phase before volatility returns. A brief dip into the $105K–$102K zone would likely mark that final washout rather than a deeper breakdown.
For investors, the key is to stay data-aware, not reactive. Watch structure, flows, and behaviour and not headlines. Each mid-cycle reset in Bitcoin’s history has punished impatience and rewarded those who positioned early for the next leg. If the past is any guide, the market is doing what it always does: shaking out leverage so conviction can take over again.
Was this newsletter forwarded to you?
If you have any questions or feedback for us, write to us at [email protected]. You can check out the previous issues here.
Disclaimer: Crypto products and NFTs are unregulated and can be highly risky. There may be no regulatory recourse for any loss from such transactions. Please do your own research before investing and seek independent legal/financial advice if you are unsure about the investments.